Measuring molecular forces
Source of molecular forces
Force
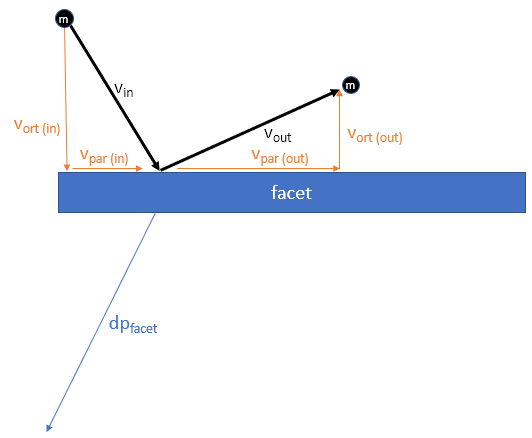
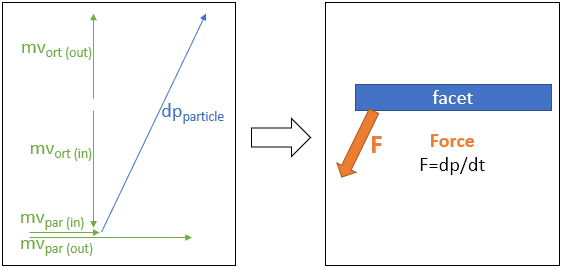
Since molecules change their impulse when bouncing from facets, an opposite impulse is exerted on the surface.
- In steady-state simulations, the continous flux of particles and thus impulse changes translate to force (F=dI/dt)
- In time-dependent simulations, the total impulse change in a moment is divided by the time window. Note that in case of a bounce, the incident impulse can belong to a different moment than the reflected (outgoing) impulse, if surface adjourn time is large
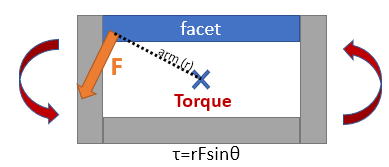
Torque
The torque is also measured, relative to a user-defined global point (by default the 0,0,0 location).
Force^2
For molecular (Brownian) noise diagnosis, a third quantity, the square of the force is also recorded (a vector squared component-wise for X,Y,Z).
Enabling force recording
By default, forces are not recorded, as they come with the following impact:
- Simulation speed is reduced by approx. 5%
- Memory requirement (per interface and per subprocess) increases by 56 bytes per facet
- The saved file will be larger as it has to store new quantitites
- Both the memory and file size requirements are multiplied by the number of moments for a time-dependent simulation
You can enable force recording for every facet for the current geometry in Tools / Measure forces:
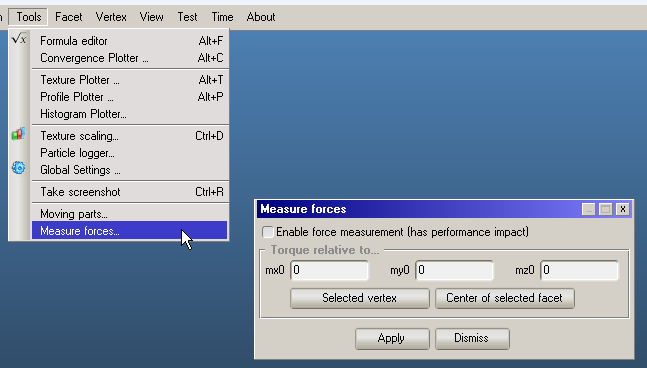
The setting applies to all facets and is file-specific, i.e. it is disabled when loading an old or empty geometry.
- Older Molflow versions will be able to open the file, but they will ignore all recorded forces, and if you save the file again, force data will be discarded
- Otherwise, newer versions will save and load force settings and recorded force data
Note
If you don't enable force recording, all quantities will be still accessible in the GUI, but will always equal 0.
Force recordings support both static and time-dependent simulations. I.e. you can record time-dependent forces.
Accessing recorded data
Recorded forces can be accessed by two tools
- Facet Details window
- Formula editor
The latter is very powerful as it can calculate summed quantities over several facets, and can be diagnosed with the Convergence Plotter.
Facet Details window
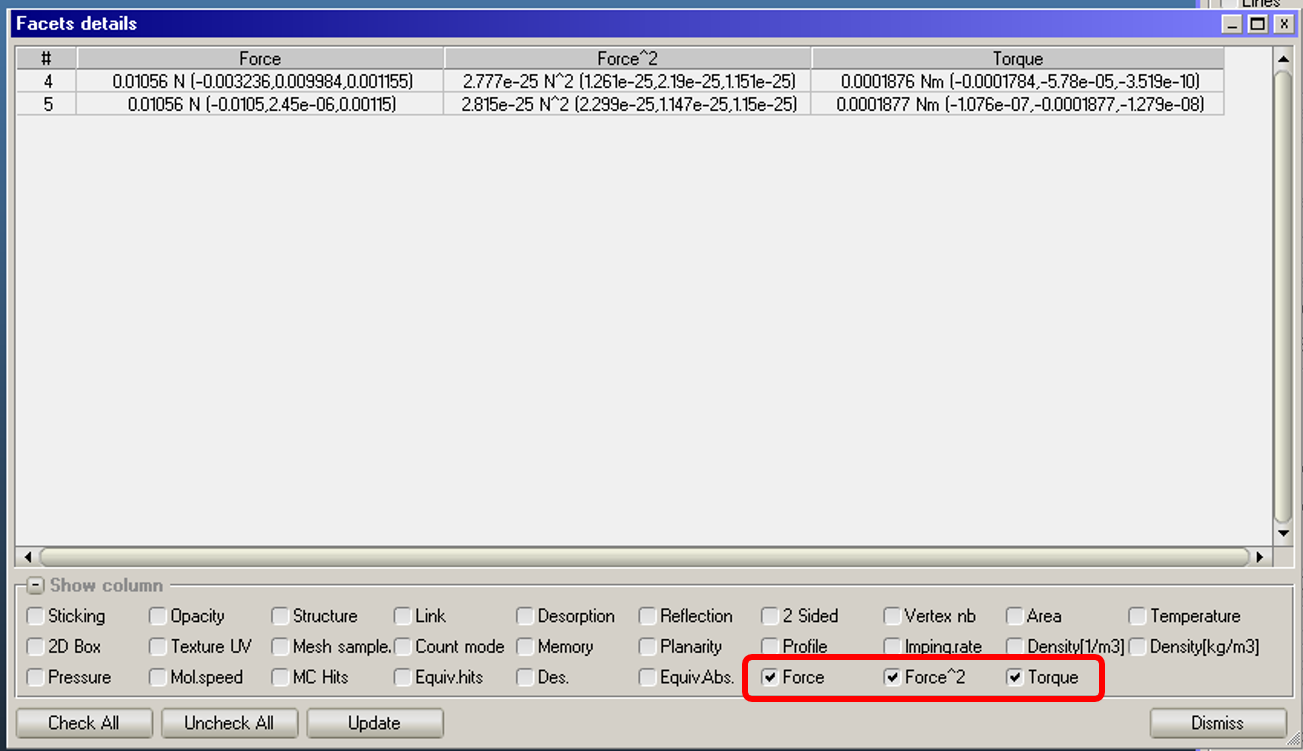
The facet details window has three new columns. For each selected facet, they display the force, force^2 and torque vector lengths and their X,Y,Z components (in parentheses).
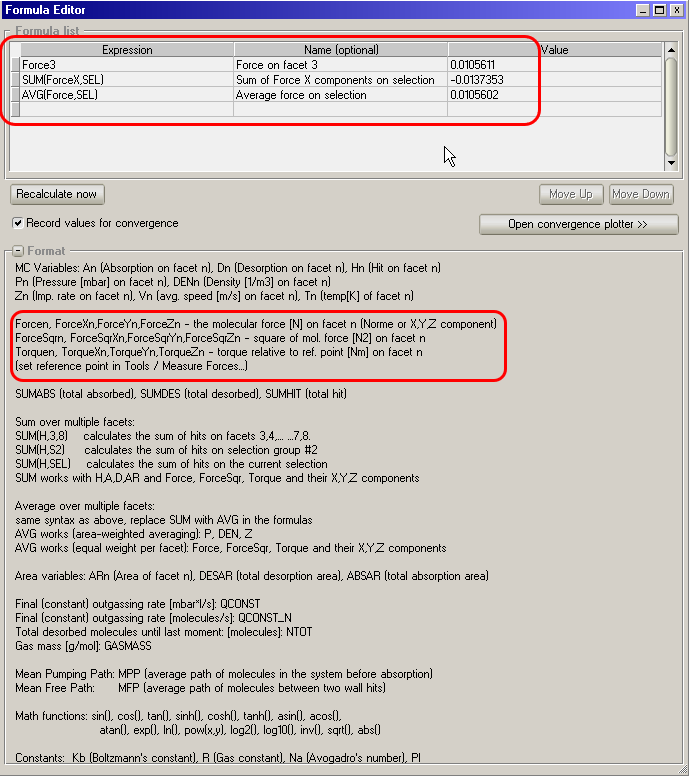
Formula editor
The formula editor window has new quantities available in the pop-out Format panel:
Simple formulas
Force6is the length of the force vector on facet 6ForceX8is the X component of the force on facet 8
and so on, the (case-insensitive) names that can be used are:
ForceForceX,ForceY,ForceZForceSqrForceSqrX,ForceSqrY,ForceSqrZTorqueTorqueX,TorqueY,TorqueZ
Sum and average formulas
SUM(ForceX,S1)will sum the X components on selection group 1.SUM(Torque,SEL)will sum on the currently selected facetsAVG(Force,S2)will average the force magnitude on selection group 2 (each facet with equal weight)
Be careful when you use summing and averaging. If you want opposite forces to cancel out, you have to sum component-wise (vectorial sum).
For example, if facet 1 and facet 2 have opposing forces of 1N each...
Force1+Force2will be 1N+1N=2NForceX1+ForceX2will be 1N + -1N = 0N
Convergence plotter
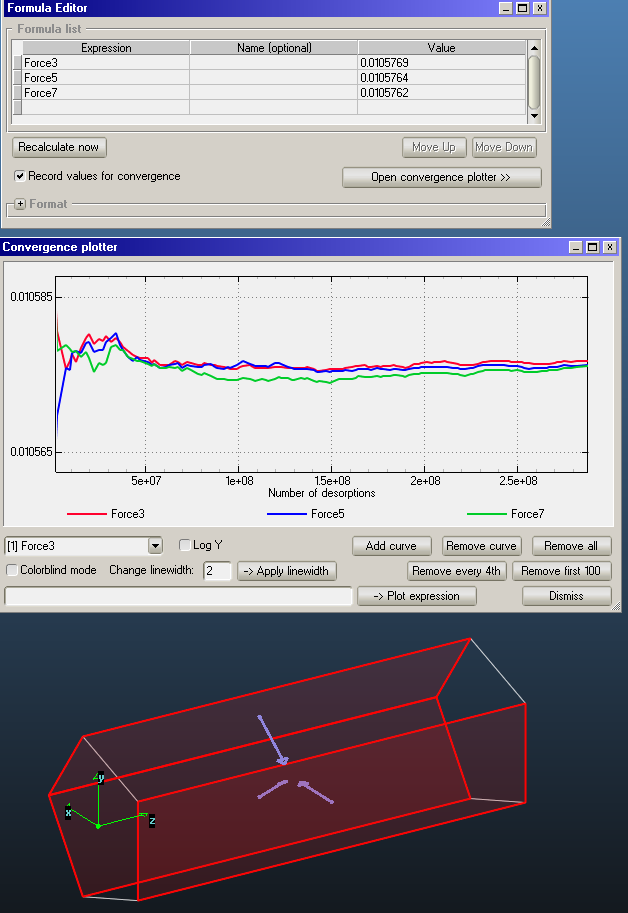
Finally, as with all formulas, you can use the convergence plotter to plot the evolution of a calculated quantity as simulation runs.
For example, you can see the forces on three different sides converging towards each other in case of a test pipe: